SPSS TRAINING
SPSS is a software package, which is used for statistical analyses. SPSS is mainly leveraged in the business analysis domain of various professionals such as Surveyors, Marketing Professionals, Market Researchers, etc. SPSS was initially a product of SPSS Inc. which is now acquired by IBM Corp. SPSS is an easy-to-learn software application.
SPSS is designed to operate in various Operating System platforms such as Windows, Mac, and Linux/Unix. The latest release of SPSS is 22.0. SPSS is a user-friendly Analysis Software.
Unlike other analytics software, SPSS has a good User Interface and is self-sufficient for many professionals, delivering with high efficiency. SPSS has pulled down menu through which the one can access the various options and features of the tool. There are two types of view in SPSS, which are Data View and Variable View.
1. Data View:
Data View is where the actual data can be viewed as it is viewed in Spreadsheet.

2. Variable View:
Variable View is where the metadata dictionary can be viewed.

Methodology:
The methodology through which SPSS is taught plays a vital role in a student’s understanding. SPSS is a GUI-based, statistical tool which needs to be trained in a student-friendly approach.
We at Ampersand Academy, train our students in the apt approach which enables them to learn SPSS at ease. Despite, the student’s knowledge of theoretical statistics in our approach enables students to learn SPSS with ease.
Scope of SPSS:
SPSS is considered one of the most leveraged tools for statistical analyses. What makes special about SPSS is its user-friendliness and comprehensiveness. SPSS has great scope both for research purposes and for jobs. SPSS is one of the vital and most leveraged tools for the statistical analysis in the research field. SPSS is used in domains such as market research, clinical analysis, econometric analyses, etc. Furthermore, SPSS has been leveraged widely in many market analytics companies and even in financial companies for analytics. Various positions offered for SPSS:


1. Research Analyst

2. Statistical Modeler

3. Statistician

4. Data Analyst

5. Business Analytics Consultant

6. Business Information Analyst
AMOS TRAINING
AMOS is statistical software and it stands for analysis of a moment structures.
AMOS is an added SPSS module and is especially used for Structural Equation Modeling, path analysis, and confirmatory factor analysis. It is also known as analysis of covariance or causal modeling software.
AMOS is a visual program for structural equation modeling (SEM). In AMOS, we can draw models graphically using simple drawing tools. AMOS quickly performs the computations for SEM and displays the results.
The calculation of SEM coefficients, AMOS uses the following methods:
>> Maximum likelihood
>> Unweighted least squares
>> Generalized least squares
>> Browne’s asymptotically distribution-free criterion
>> Scale-free least squares
Construction of model in AMOS:
First, we have to run AMOS. By clicking the “start” menu and selecting the “AMOS graphic” option, we can run the program. The moment AMOS starts running, a window appears called the “AMOS graphic.” In this window, we can manually draw our SEM model.
Attaching Data:
By selecting a file name of the data file option, we can attach data in AMOS for SEM analysis. This option also appears if we will click on the “select data” icon.
Observed Variable:
A rectangle icon is used to draw the observed variable.
Unobserved Variable:
A circle icon is used to draw the unobserved variable.
Cause Effect Relationship:
A single headed arrow in AMOS is used to draw the cause-effect relationship between the observed and unobserved variables.
Covariance:
A double-headed arrow is used to draw the covariance between variables.
Error Term:
In AMOS, the error term icon is next to the unobserved variable icon, and it is used to draw the latent variable.
Naming the Variable:
When we right click on a variable in a graphical window, the first option, “object properties,” is used to give the name of the variable in AMOS.
There are other icons as well, and these icons help in drawing the SEM model graphical. Icons such as erase icon, moving icon, calculate icon, view text, analysis properties, etc., help in drawing the SEM model graphs.
Understanding the text output in AMOS:
After running the analysis, we can see the results on the graphics window. We can also see the text output. The graphics window will only show the standardized and unstandardized regressions and error term weights. All results will be shown in the text output. AMOS will produce the following important output:
Variable Summary:
In AMOS and its text output variable summary, we can see how many variables and which variables are used for SEM analysis. We can see how many observed variables and how many unobserved variables were in the model.
Accessing the Normality:
In SEM model, data should be normally distributed. AMOS will give the text output, and Skewness, Kurtosis and Mahalanobis d-squared test will tell us about the normality of the data.
Estimates:
In AMOS text output, the estimation option will give the result of regression weight, standardized loading for factor, residual, correlation, covariance, direct effect, indirect effect, total effect, etc.
Modification Index:
In AMOS text output, the modification index result shows the reliability of the path drawn on the SEM model. If MI index value is large, then we can add more paths to the SEM model.
Model Fit:
In AMOS text output, the model fit option will give the result for the goodness of fit model statistics. It will show all the goodness of fit indexes, such as GFI, RMR, TLI, BIC, RMSER, etc.
Error Message:
If there is any problem, during the process of drawing the model (for example, if we forget to draw the error term or if we draw the co-variance between two variables, or if missing data is present), then AMOS will either not calculate the result or it will give an error message.
JAVA TRAINING PROGRAM
Java is an object-oriented programming language whose history dates back to 1994 when Sun Microsystems came up with an idea of a programming language that can be compiled and executed independently of the machine on which it is used.
Java is a very popular object-oriented programming language, particularly in client-server web applications. Java is an underlying technology required by many applications and websites and you’ll find it just about everywhere— laptops, data centers, business applications, game consoles, utilities, cell phones and more.
Java is a programming language used mainly to develop web applications and platforms. Being a platform-independent, it is popularly used everywhere as it can be accessed and run easily from any platform. Applications developed from Java are used for many devices such as computers, smartphones, laptops, car navigation systems, media players, etc.

Advantages:
• Java is object-oriented programming language.
• This allows you to create modular programs and reusable code.
• Java is platform-independent.
• In simple words, the motive of building Java was to remove the barrier of platform dependency of programming languages.
• This striking feature received a lot of attention and soon Java became one of the sought-after programming languages that could be used for small and medium-sized software development purposes. As the time advanced, Java grew from being a platform-friendly language for user-friendly programming as well.
• Its simplicity, robustness and open nature started attracting even bigger software makers of the industry and ever since there was no turning back.
Classification of Java:
Based on popularity, usability and industry demand, Java can be categorized under the following sections:
• Client-side Java development: This section of Java is based on developing software and program modules that can run on the client side to support its daily operations. E.g. SAP
• Server-side Java development: This section of Java is based on developing codes that can enable others to access dedicated servers designed to perform specific tasks. E.g. Creating a stand-alone database server.
• Web Development: Java libraries are also extended to Java server pages (JSP) that helps in rich content development for Web.
• Mobile Development: Java is actively implemented as a standard language for developing mobile operating systems and applications. Eg. Android.
• Machine learning through Java: Recent advancement in Java is in the direction of Machine learning which has helped in building and supporting several electronic devices ranging from Space shuttles to CT scan machines.
MATLAB TRAINING
MATLAB is a programming language developed by MathWorks. It started out as a matrix programming language where linear algebra programming was simple. It can be run both under interactive sessions and as a batch job.
MATLAB is a high-performance language for technical computing. It integrates computation, visualization, and programming in an easy-to-use environment where problems and solutions are expressed in familiar mathematical notation.
Typical uses include:
• Math and computation
• Algorithm development
• Modeling, simulation, and prototyping
• Data analysis, exploration, and visualization
• Scientific and engineering graphics
• Application development, including Graphical User Interface building


MATLAB is an interactive system whose basic data element is an array that does not require dimensioning. This allows you to solve many technical computing problems, especially those with matrix and vector formulations, in a fraction of the time it would take to write a program in a scalar non-interactive language such as C or Fortran.
The name MATLAB stands for matrix laboratory. MATLAB was originally written to provide easy access to matrix software developed by the LINPACK and EISPACK projects, which together represent the state-of-the-art in software for matrix computation.
MATLAB has evolved over a period of years with input from many users. In university environments, it is the standard instructional tool for introductory and advanced courses in mathematics, engineering, and science. In industry, MATLAB is the tool of choice for high-productivity research, development, and analysis.
MATLAB features a family of application-specific solutions called toolboxes. Very important to most users of MATLAB, toolboxes allow you to learn and apply specialized technology. Toolboxes are comprehensive collections of MATLAB functions (M-files) that extend the MATLAB environment to solve particular classes of problems. Areas in which toolboxes are available to include signal processing, control systems, neural networks, fuzzy logic, wavelets, simulation, and many others.

The MATLAB system consists of five main parts:

The MATLAB language
This is a high-level matrix/array language with control flow statements, functions, data structures, input/output, and object-oriented programming features. It allows both “programming in the small” to rapidly create quick and dirty throwaway programs, and “programming in the large” to create complete large and complex application programs.
The MATLAB working environment
This is the set of tools and facilities that you work with as the MATLAB user or programmer. It includes facilities for managing the variables in your workspace and importing and exporting data. It also includes tools for developing, managing, debugging, and profiling M-files, MATLAB’s applications.
Handle Graphics
This is the MATLAB graphics system. It includes high-level commands for two-dimensional and three-dimensional data visualization, image processing, animation, and presentation graphics. It also includes low-level commands that allow you to fully customize the appearance of graphics as well as to build complete Graphical User Interfaces on your MATLAB applications.
The MATLAB mathematical function library
This is a vast collection of computational algorithms ranging from elementary functions like sum, sine, cosine, and complex arithmetic, to more sophisticated functions like matrix inverse, matrix eigenvalues, Bessel functions, and fast Fourier transform.
The MATLAB Application Program Interface (API)
This is a library that allows you to write C and Fortran programs that interact with MATLAB. It includes facilities for calling routines from MATLAB (dynamic linking), calling MATLAB as a computational engine, and for reading and writing MAT-files.
R-PROGRAMING
Java is an object-oriented programming language whose history dates back to 1994 when Sun Microsystems came up with an idea of a programming language that can be compiled and executed independently of the machine on which it is used.
Java is a very popular object-oriented programming language, particularly in client-server web applications. Java is an underlying technology required by many applications and websites and you’ll find it just about everywhere— laptops, data centers, business applications, game consoles, utilities, cell phones and more.
Java is a programming language used mainly to develop web applications and platforms. Being a platform-independent, it is popularly used everywhere as it can be accessed and run easily from any platform. Applications developed from Java are used for many devices such as computers, smartphones, laptops, car navigation systems, media players, etc.
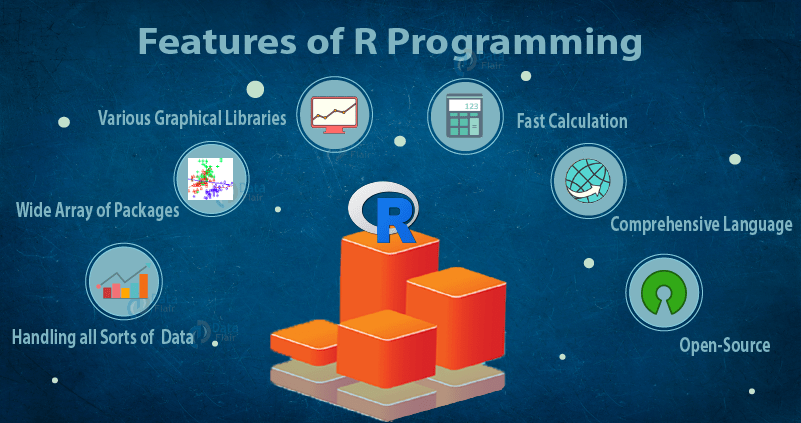
Advantages of R Programming:
>> R Programming is the best mechanism for statistics, data analysis, and machine learning. It is more than a statistical package; it’s a programming language so that you can create your objects, functions, and packages.
>> Like all applications, R programs explicitly record the actions of analysis and make it easy to reproduce and update report, which means it can quickly try many ideas and factual issues.
>> It can easily use it anywhere. It’s platform-independent, so it can apply it to each operating system. And it’s free, so it can implement it in any organization without purchasing a license.
>>Not solely is R Programming free, but it’s also open-source. That means anyone can examine the source code to see exactly what it’s doing. This also means that anyone, can fix bugs and add features, rather than waiting for the vendor to find/fix the bug and add the feature –at their discretion– in a future release.
